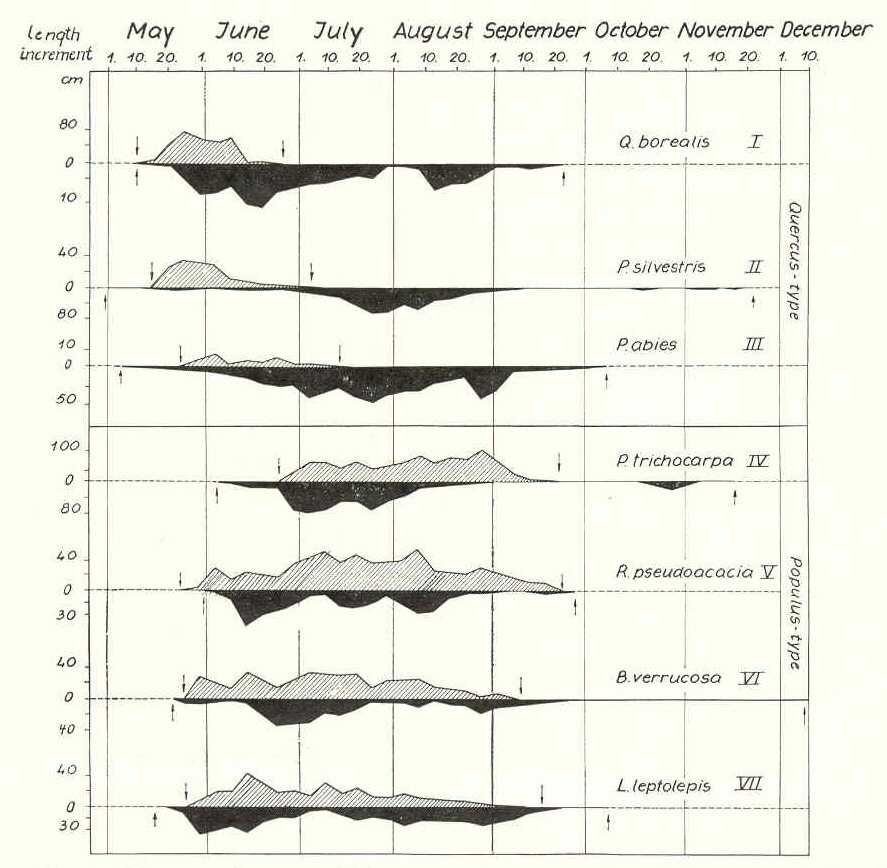

FIG. 8. Schematic diagram of the course of root growth and shoot growth of eight tree species in the Eberswalde root laboratory. Shading indicates shoot growth; solid black represents root growth; start and termination are indicated by arrows (data from Hoffmann, 1966d).
Page 200