
Spruce Budworms Handbook
Shigometry – A Reference Guide
United States Department of Agriculture
Forest Service
Cooperative State Research Service
Agriculture Handbook No 646
In 1977, the United States Department of Agriculture and the Canadian Department of the Environment agreed to cooperate in an expanded and accelerated research and development effort, the Canada/United States Spruce Budworms Program, (CAN USA), aimed at the spruce bud worm in the East and the western spruce bud worm in the West. The objective of CANUSA was to design and evaluate strategies for controlling the spruce bud worms and managing bud worm-susceptible forests to help forest managers attain their objectives in an economically and environmentally acceptable manner. The work reported in this publication was wholly or partially funded by the program. This manual is one in a series on the spruce budworm.
Canada United States Spruce Budworms Program
November 1985
[Note from webmaster. Where the word vigor is used in this text, has more recently been replaced with the word vitality. I believe when the word vigor is used, that vitality is what is meant. For an explanation of them and many other common tree biological terms, see my dictionary. The needle probe can check relative vitality within a species. Vigor is genetically encoded. I say this to avoid adding confusion by producing this paper. www.treedictionary.com John A. Keslick, Jr
Contents
What is Shigometry? 5
What is a Shigometer? 5
How Does the Shigometer Operate in Wood? 5
How Does the Shigometer Operate in the Cambial Zone? 5
Decay in Trees 6
Heartwood and Discolored Wood 6
Decomposed Wood 6
Wetwood 6
Wood Products 6
Factors Affecting Electrical Resistance 6
Moisture 6
Temperature 6
Ions 6
Electrode Spacing and Surface Contact 6
Meter Misuse 7
How To Use Internal Electrical Resistance (IER) Readings 8
How To Use Cambial Electrical Resistance (CER) Readings 8
Ratio Method 8
Utility Poles 9
Checklist 9
Drilling and Drill Bits 9
Bending Wire Electrodes and Other Electrode Problems 9
Meter Problems 10
Double-Needle Electrodes 10
Some Specific Uses for the Shigometer 10
Permanent Inventory Plots 10
Plantations 10
CER of City Trees 10
Hazard Trees 10
Cavity Work and Cabling and Bracing 11
Genetic Selections for "Tough" Trees II Dormancy 11
Ends of Logs 11
ER Patterns of Freshly Cut Boards 11
Wood Durability 11
Soft Rots 12
Use of the Shigometer on Spruce-Fir Sites 12
ER and Site Growth Potential 12
CER and Site Classification 12
CER Values for Spruce and Fir 13
Further Refinements Start 13
CER, Stress, and Mortality 14
Photo Guide 14
Tree Care Basics 14
The Shigometer 29
Utility Poles 36
ER Patterns 41
Selected References 45
Page 3
Shigometry: A Reference Guide
by
Alex L. Shigo and Walter C. Shortle
What is Shigometry?
Shigometry is a procedure that helps determine relative vigor of trees and the condition of wood-sound or decayed-by interpreting patterns of electrical resistance (ER) given by a pulsed-current meter, the Shigometer.™ Double noninsulated needle electrodes are pushed into the bark to measure cambial electrical resistance (CER). A twisted-wire electrode is inserted into a hole drilled into a tree or wood product to measure the internal electrical resistance (IER). CER is used to help determine relative tree vigor. IER is used to help determine the condition of the wood in living trees and wood products.
Wood condition is reflected in its moisture and ion concentrations, which are fairly constant in healthy tissues; and although they may change over the year, they do follow regular patterns. When a pulsed current is passed through infected tissue, the current passes with either more or less resistance than it would through healthy tissue.
This guide explains how to test the condition of living trees or wood products by use of the Shigometer and gives instructions for its use. The guide is in three parts: (1) An introduction on operating principles and applications, (2) an example of the procedure, and (3) a photo guide that gives details on the procedure and background information needed to use it.
'The authors are, respectively, chief scientist (retired) and research plant pathologist, USDA Forest Service, Northeastern Forest Experiment Station, Durham, NH. Alex L. Shigo is the leader of a pioneering project on discoloration and decay in trees, and Walter C. Shortle is a biochemist with that research unit.
What is a Shigometer?
The Shigometer is a battery-operated, lightweight field ohmmeter. It generates a pulsed direct electric current and registers in thousands of ohms (kΩ) the resistance to the current as it passes through wood or bark.
Two models are now in use: A meter with a dial ohmmeter, model 7950, that was manufactured by Northeast Electronics Co., Concord, NH; and a
newer model with a digital ohmmeter, model OZ-67, manufactured by the Osmose Wood Preserving Co., Inc., Buffalo, Ny.²
How Does the Shigometer Operate in Wood?
When the temperature is above freezing and a pulsed direct electric current is passed through wood that has a moisture continuum, the resistance to the current will be directly affected by the concentration of positively charged ions, or cations, in the wood.
How Does the Shigometer Operate in the Cambial Zone?
As the cambial Zone - cells formed by the cambium that have not yet differentiated - increases in thickness, it can hold more moisture, and more moisture can hold more ions. The thicker the cambial zone, the lower the electrical resistance. The thicker the cambial zone, the more vigorous the tree.
The use of trade, firm, or corporation names in this publication is for the information and convenience of the reader. Such use does not constitute an official endorsement or approval by the U.S. Department of Agriculture, or the Forest Service, of any product or
service to the exclusion of others that may be suitable.
Page 5
Decay in Trees
The electrical procedure helps to identify the stages of the decay process, not the results of the process.
Heartwood and Discolored Wood
Before wood begins to decay, it becomes wetter and contains more ions. Early stages of whiterot are associated with increasing potassium ion concentration; brown rot , with increasing hydrogen ion concentration (decreasing pH).
The important thing to remember is that rapid ionic changes are measured as substantial differences in ER of the wood and take place before wood becomes visibly decayed. This means that both decaying and decayed wood can be detected by electrical methods.
Decomposed Wood
In advanced stages of decay, the tips of the electrode may have intermittent contact with the wood and the ER will increase and decrease abruptly.
Wetwood
After boards are cut from logs, the wetwood retains moisture longer than sound wood. As wetwood dries in wood products, cracks and wood shrinkage will occur.
Wood Products
Many problems in wood products have their origin in the living tree. The sooner defects are detected, the better the chances are for making decisions on the best use of the wood.
In freshly cut logs, infected wood gives a much lower ER reading than that in contiguous sound wood. When the logs will be utilized for long-term products such as utility poles, use of the Shigometer can help detect unsound, but not visibly defective, wood. Low ER readings near large, open branch stubs or near the base of the tree may indicate extension of decay columns.
Factors Affecting Electrical Resistance
Electrical resistance of a pulsed current through wood or bark is affected greatly by moisture content, temperature, and concentration of cations or electrolytes. The physical condition of the substance may also play a part, together with distance between and type of electrodes and their degree of penetration into the wood.
Moisture
Wood in living trees will usually be above the fiber saturation point, or approximately 27 percent weight of water over weight of oven-dried wood when volume is constant.
The Shigometer functions above the fiber saturation point. Regular moisture meters function below the fiber saturation point. Above fiber saturation, as free water increases, ions become the dominant variable in determining ER. When moisture content is near fiber saturation, moisture will be the major factor affecting ER. As moisture content exceeds 60 percent, increasing amounts of moisture will have very little effect on resistance readings.
Temperature
When the temperature is near freezing, small temperature changes will have a great effect on ER. After temperatures reach 40 ºf (5 °C), additional increases will have little effect on resistance.
Ions
Concentration of ions will have the greatest effect on resistance when temperatures are above 40 ºF and moisture content is above 60 percent. In living trees, moisture content is usually above 60 percent. As
wood decomposition increases, concentrations of ions usually increase.
Electrode Spacing and Surface Contact
The spacing of the electrodes affects resistance readings, especially if the electrodes are very far apart more than 6.5 ft (2 m)-or if they are very close together-less than four-fifths of an inch (2 cm). Operators should keep the spacing as constant as possible and well within these extremes.
Page 6
The amount of electrode surface in contact with the wood or bark affects resistance readings. The operator should standardize the amount of contact that the needle electrodes have in the bark by pushing them in until the wood is touched.
Meter Misuse
The shigometry procedure will not function in wood below the fiber saturation point or where decayed wood is resin soaked or dry. The procedure will not work when wet wood fluids flood the drill hole. The needle electrodes will not measure CER when they'" are placed into dead wood. The procedure also will not work in frozen tissues.
Page 7
How To Use Internal Electrical Resistance (IER) Readings
Shigometry can be used to determine the internal condition of living trees and some wood products, especially inservice utility poles. In trees and poles, the operator first drills a small hole into the wood. The diameter of the hole is seven sixty-fourths of an inch (2.8 mm). The depth may be 8 to 12 inches (20.3 to 32 cm) or more, depending on the length of the drill bit. The operator next attaches a special twisted-wire electrode to the meter. The electrode has a tip that both sends and receives the electrical current.
As the operator slowly pushes the electrode into the predrilled hole, the changes in ER of the wood along the hole are shown in kΩ on the meter. In sound trees, the ER is lowest at the cambial zone and usually increases as the electrode is pushed inward. When the electrode tip touches heartwood, there is a sudden increase in ER. When the electrode tip touches wood that is wetter than normal and has concentrations of ions greater than that in normal wood (for example, wood in the early stage of decay), there is a drop in ER. How far the ER decreases depends on the ionic condition of the wood. '
Before one can use shigometry to assess wood condition, the pattern of ER readings for healthy, sound trees must be determined on a species-by-species basis. For large groups of trees, the baseline ER pattern will be similar. For example, healthy beech, birch, maple, ash, poplar, and so on, will have similar readings. Oak, walnut, cherry, locust, and other heartwood-forming trees make up another pattern group. The pine group and the fir and spruce groups have still other patterns.
A sudden drop in ER below a typical reading of the species indicates wood with high moisture and high ion concentration. In species that usually have wetwood, a sudden ER drop confirms its presence, especially when the drilling torque does not decrease while the hole is being drilled. Wet wood fluids, which are generally darker than sap, usually flow out of such holes. To determine the internal boundary for columns of wetwood, the operator drills above the first hole in increments of two-fifths of an inch (1 cm) until the wet wood is reached.
Decreased drilling torque and changes in color of the drill shavings are good indicators of possible problems within wood or wood products.
How To Use Cambial Electrical Resistance (CER) Readings
Double, noninsulated needle electrodes are used to determine CER. The thicker the cambial zone, the lower the ER.
CER increases at the beginning of dormancy. In cold climates, CER readings from trees with high and low vigor are similar during midwinter. When temperatures are near freezing, however, temperature then becomes the major factor affecting resistance. When bark tissues are below freezing, shigometry will not work.
As with IER, operators must determine a mean CER of each species being evaluated. To determine the mean, CER is measured at two points on at least 20 healthy trees selected at random. CER readings on other trees of that species can then be compared to the mean. Trees with CER readings lower than the mean are more vigorous than those at the mean. Trees with CER readings higher than the mean are less vigorous than those at the mean.
There are two basic ways to use CER readings:
1. Accurately characterize the trees on the basis of objective measurements. For example, choose samples of trees that represent the extremes of the observed range of measurements. Measure the CER of the extremes to determine whether there is a statistically significant difference between the two extremes. Never concentrate on the middle readings in first-time studies. Over time, or space, you may find that the middle readings are moving toward one extreme or the other.
2. Take many CER readings from a large random sample. Next, select two groups that best fit each extreme CER set. Then study the measurable characteristics of the two sets of extremes to determine whether they are statistically significant. Again, stay away from the middle readings in your first studies. As you learn more about the extremes, you will be able to work toward the middle.
Ratio Method
In the ratio method, the reading is divided by the mean. Trees more vigorous than the mean will have ratios less than 1, and trees less vigorous than the mean will have ratios greater than 1.
Page 8
Utility Poles
Shigometry can be helpful in determining which living trees would make the best utility poles. It can detect resin-soaked zones that sometimes develop around old wounds and stubs. These zones do not accept preservatives readily. And wood preservatives usually have a shorter effective time in wood that was already infected in the living tree.
For utility poles already in place, the internal decay detection procedure can be used at groundline. If wood is decaying, the wood will be above the fiber saturation point. Basic patterns of ER must be determined first. Sudden drops in ER indicate higher moisture-ion content of the wood and therefore presence of decay.
Checklist
Here are some suggestions for operators using the Shigometer in the field. These points are amplified in the "Photo Guide" section and the section on ER patterns at the end of this handbook.
Drilling and Drill Bits
. Make certain that drill bits are firmly held in drill chuck.
. Guide drill in by cupping hand around the drill bit.
. Do not make sudden moves. They will break drill bits.
. Drill at a comfortable position that will use your arm to best advantage to push straight inward on the drill.
. Make certain that reverse drill position has not been accidentally set.
. Do not touch hot drill bits.
. Keep tip of bit sharp.
. Keep flutes at drill tip free from wood shavings.
. Drill in and out several times before going inward the entire distance.
. Do not waste power. Pull the drill out quickly.
. Do not be afraid to push on the drill.
. Learn by the sound when pressure is too great.
. Recharge batteries after they have lost all power.
Do not recharge batteries that still have some power. Some rechargeable batteries seem to have a "memory." It is best to run batteries down completely by holding and operating the drill in the air before recharging. A small gasoline-powered generator is best for jobs that require many drillings.
Bending Wire Electrodes and Other Electrode Problems
The wire should fit tightly into the hole. Always clean the tips of the electrode with your fingernails and spread the tips slightly before performing each probe.
If the meter is registering kΩ below 500 when the electrode is in open air, the tips are dirty or stuck together. Be alert for this when working with pines and trees that have a sticky or milky sap.
Look for worn insulation along the electrode shaft. This causes very erratic readings. Also, check for shorts at the plastic end of the electrode.
Page 9
Meter Problems
Use care when changing batteries, especially in the older dial meter. Clean the terminals before inserting new batteries. It is also wise to apply some saliva on the terminals and then roll the batteries in the terminal sockets. This solves many problems when batteries must be changed.
Be alert for accidentally-turned knobs, especially when moving through the forest or from one pole to another.
Double-Needle Electrodes
Older model double-needle electrodes may short. Shake wires to check for shorts in the handle and in the socket within the meter.
Needles suffer metal fatigue after heavy use. Move needles into bark and wood with a gentle up and down motion. Avoid abrupt changes in position when inserting or removing the needles.
Always carry extra needles. A plastic 35-mm film cartridge can be used as a container for the needles, and extra needles can be stuck into the ends of the container.
Some Specific Uses for the Shigometer
Permanent Inventory Plots
On a small sample of trees in permanent inventory plots, the internal condition of the trees and the relative vigor should be measured. Internal measurements show the width of sound wood in the sampled trees. The CER would show whether the trees are growing more or less vigorously than other groups of trees. The ratio method, with each reading divided by the mean reading for that species, should be used so the vigor of trees of different species can be compared in a mixed stand. This information could be put on a computer and the changes in internal defects and relative vigor could be followed over time.
Plantations
CER readings help identify at an early age the very vigorous trees. The CER method makes it possible to rank the relative vigor of particular trees. By entering such data into a computer, managers could compare, for example, the CER means for plantations. The CER method is also very rapid and can save valuable time.
CER of City Trees
The CER of city trees could also be put into a computer. Again, the ratio method (reading divided by mean) would be best so individual species could be observed over time.
The CER of recently planted trees can indicate early problems. One side of a tree may be very weak while the other side may be very strong. Knowledge of the weak and strong sides may help when pruning or fertilizing. A CER record of trees before and after fertilization or other treatments could also help field crews determine which trees should be treated.
The CER can be taken very quickly to determine the relative vigor of trees. This measurement can give valuable information, especially on trees that are extremely important, such as the cover photo of an American elm on the lawn of the U.S. Capitol.
Hazard Trees
When crews examine what looks like a high-hazard tree, they should check the base of the tree and exposed roots to determine their soundness. Areas that
Page 10
are suspect because of fungus fruiting bodies, cracks, dead bark, old wounds, insect holes, and other signs should be assessed with the meter.
When a large cavity is obvious, the operator should check the width of sound wood 1 ft (0.3 m) above the top of the cavity and on the opposite side of the trunk. The measurement will reveal the amount of sound wood present behind and above the cavity. If the tree has a great amount of sound wood at this position, it usually will not be at hazard. Additional measurements should be made on suspect trees.
Cavity Work and Cabling and Bracing
Internal measurements indicate the width of sound wood in the trunk behind the cavity. If the cavity is a "stovepipe" or only a very short hole, then treatment will differ greatly.
Hardware should never be partially put into decayed wood. If wood is decayed, put hardware or rods and bolts entirely through the trunk. Check CER of the margins of the obvious cavity to determine whether bark is alive or dead.
Genetic Selections for "Tough" Trees
Some trees within a species can resist the spread of decay much better than others. In research studies, it is often necessary to bore many large holes into trees to determine the type of wound response for the individual tree. To determine length of defect associated with wounds, it is not necessary to cut the tree.
Drill a measurement hole 4 inches (10 cm) above the wound, and a second hole 2 inches (5 cm) to the right or left of the measurement hole. With the twisted-wire electrode, measure the ER above the original wound and the ER in the control wood to the side of the wound. If the wood above the original wound is discolored or decayed, the ER will be lower than the ER of the control wood. If both ER readings are the same, then the defect column is less than 4 inches (10 cm) above the original wound. In some trees, it may be necessary to bore the test holes higher than 4 inches (10 cm) above the original wound.
Dormancy
As trees go into dormancy, the cambial zone begins
to decrease in thickness. As the zone decreases, CER increases. The patterns of CER may be helpful in determining the stage of dormancy. When trees start to grow in the spring, CER usually decreases.
Ends of Logs
The needle electrode may be used to determine an ER profile at the ends of cut logs. The profile may show the difference between sound discolored wood and discolored wood with advanced decay that will cause problems in a product. End-of-log ER measurements could help greatly in fixing drying schedules, especially for softwoods.
To make ER measurements in the end of a log, the log must have wood above the fiber saturation point. The defective zones in the wood will hold moisture much longer than the sound wood, and over time the differences between the ER of sound and defective wood become greater.
Establishing a profile takes only a few minutes for each log. The pattern of ER readings from the obviously sound logs can then be used as a baseline for assessing suspect logs. For logs that will be turned into high-value products, such measurements are extremely cost effective.
ER Patterns of Freshly Cut Boards
ER readings can be taken on freshly cut boards to determine wetwood zones. This is especially important for softwoods. Such information can greatly help in determining drying schedules. Then boards with different amounts of wetwood could be sorted from boards free of wetwood.
Wood Durability
The ratio of ER readings between sapwood and heartwood may be an indicator of wood durability. Heavy amounts of extractives in heartwood lead to high ER readings. High amounts of extractives have been
shown to be associated with high durability. When sapwood ER readings are low and heartwood readings are very high, durability may be high. When there is
Page 11
very little difference in ER between sapwood and heartwood, durability may be low.
Soft Rots
Soft rot at the groundline in utility poles may be shown with the needle electrodes. First, the operator makes a quick series of probes around the base of the pole. The needles should be one beside the other when inserted into the pole. In sound dry wood, the needles will be very difficult to push into the wood. In suspect zones, the needles will penetrate easily. The ER of the sound areas will usually be far above 250 kO. Readings in the 50 kO range indicate soft rot or outer shell rot.
Use of the Shigometer on Spruce-Fir Sites
A rapid, simple, quantitative estimate of growth potential was needed to help assign risks to sites as a guide to management decisions about salvage operations (high-risk sites), protective sprays (intermediate- risk sites), and increased monitoring (low-risk sites). A separate index value for internal decay potential also was needed to help assign risks to sites producing fir and spruce wood. A site with a low growth potential and a high decay potential has a greater risk of loss than one with low decay potential.
ER and Site Growth Potential
A preliminary evaluation of electrical methods for estimating site growth potentials using CER measurements was conducted in 1978 in cooperation with International Paper Company on continuous forest inventory plots. These 694-yd² (580-m²) plots were inventoried from mid-June to mid-August. After standard tree measurements had been made, the CER of each tree greater than 4.7 inches (12 cm) d. b. h. was determined using a standard procedure. The measurements (two per tree on opposite faces) took about 10 seconds per tree or about 8 to 10 minutes per plot depending on tree spacing, number of trees, and ease of walking between trees. An average CER for each major tree species on each plot could be determined as a basis for comparison to periodic growth rates determined independently from diameter measurements taken on the same trees at the same position every 5 years.
At the end of the summer, the results for all plots were combined for the seven major tree species observed (balsam fir, red spruce, yellow and paper birch, sugar and red maple, and beech). A grand mean CER was calculated for each species. Trees on plots with CER values less than the mean were growing better-had a higher periodic growth rate over the past 5 years-than those on plots with CER values greater than the mean. This was consistent with earlier studies done primarily on maple.
CER and Site Classification
Results from the preliminary field study and previous research studies indicated that it was possible to classify sites by a rapid, simple, quantitative rating system shown in table 1.
Page 12
Table 1-Estimating the potential of trees to grow and to decay using measurements of cambial electrical resistance (CER) and internal electrical resistance (IER)
'CER = mean cambial electrical resistance in kΩ for a sample of canopy trees of a given species representative of a given site. Measurements are taken during the growing season. Values a and b used to estimate growth potential are determined empirically. For fir and spruce a = 10 kΩ and b = 12 kΩ.
²IER = mean internal electrical resistance in kΩ, for a subsample of the canopy trees for which CER is determined. Measurements are taken at a fixed depth, and values of x and y are determined empirically. For fir and spruce a depth of 4.5 cm was used, and values of x = 250 kΩ and y = 100 kΩ in the first approximation.
The system is not a substitute for methods used to determine actual periodic growth rate if such methods are needed. But it is a simple way to compare differences in growth potential from site to site and changes in growth potential within sites from time to time. This information can be used to help determine risk during periods of high stress, such as that caused by spruce budworm defoliation.
CER Values for Spruce and Fir
To establish an upper and lower limit of CER and IER-internal ER-that would separate sites into classes that related to some level of risk, we began field studies under the auspices of the Canada/United States Spruce Budworms Program in 1979. The first year we attempted to define the range of CER values on spruce-fir sites in areas of severe to no defoliation. We looked at more than 10,000 trees in some 90 stands on 90 different sites across northern Vermont, New Hampshire, and Maine. We used a point sampling scheme and measured at least 100 trees per site using a standard method to determine CER. Stand- site values of CER (mean CER of all trees greater than 4.7 inches d.b.h.) ranged from 9 to 18 for balsam fir and 7 to 13 for red spruce.
Two sites representing the extreme range of balsam firs without defoliation (CER 9 and CER 13) and with defoliation (CER 13 and CER 18) were sampled for periodic growth. Ten trees representing each of eight sites were cut after the growing season. Disks were removed at stump height, breast height, and base of the live crown, and incremental growth was measured for each disk along the longest and shortest radius for the past five annual rings.
The results indicated that trees representing CER class 9 sites were growing about twice as fast as those on CER class 13 sites whether defoliated or not. No further reduction in periodic growth occurred on CER class 18 sites compared to class 13 sites. This may indicate more than a simple growth reduction in response to severe stress. A rise in CER beyond levels associated with growth differences has been related to impending mortality in several hardwood species.
Further Refinements Start
We repeated our observations primarily on balsam fir, which was sustaining greater damage than red spruce. Over the next 3 years by varying our sample schemes, equipment, and methods, we were able to empirically refine our threshold values for CER, and we began developing the IER method. We also attempted to discover how CER was related to periodic growth rate. Trees on a variety of sites were observed, and a subsample of representative trees was
Page 13
cut for determination of periodic growth and for other experimental purposes.
Our work to date indicates that sites whose fir trees have CER readings averaging less than 10 kΩ consistently have periodic growth rates about double those of sites with average CER greater than 12 kΩ. Sites with trees whose CER's average 10 to 12 kΩ tend to be intermediate but have growth rates overlapping those sites with tree readings less than 10 and greater than 12. Such sites are probably transitional and need to be observed over time to see if growth is increasing or decreasing. Similar trends seem to apply to red spruce, though we sampled much less spruce than fir.
CER, Stress, and Mortality
We were not able to observe the death of trees from chronic stress, but we applied acute stress by girdling fir and spruce trees. After girdling, there was a rapid rise in CER, followed by bark beetle infestation, followed by decreasing CER as trees became infected, and finally, death of the crown. Trees with CER greater than 12 kΩ before girdling succumbed well before those with CER less than 10 kΩ, indicating a greater vulnerability to stress for trees with high CER (low growth potential).
A new method for determining an IER value for each site was attempted for fir and spruce using one measurement per tree at a depth of 1.8 inches (4.5 cm). Early results were promising. Sites with an IER greater than 200 kΩ in all observed stems yielded trees of much greater soundness than those in which IER of all stems was less than 100 kΩ. However, techniques of measurement and evaluation must be refined further.
Each combination of growth and decay has its own risks, problems, and remedies. Electrical methods can be used to establish some classification of the potential of trees to grow and to decay. The index values used in electrical methods are based on rapid, simple, quantitative observations once a standard procedure has been developed. However, interpretation of what is observed is not simple and requires an understanding of the complex growth and decay processes in trees.
Photo Guide
Tree Care Basics
The photographs show the long sequence of events that occur after wounding and the many complex patterns of discolored and decayed wood. The photographs also show that wood associated with injury and infection ranges from slightly altered to completely decomposed.
The ER patterns within a tree often are varied because the condition of the wood is so varied. Shigometry rarely reveals single columns of uniformly altered wood contiguous to the sound wood.
Figure 1 illustrates on a red
maple the damage associated with flush-cut pruning. The decayed wood is
bleached above and below the flush-cut branch. The color of the wood changes as
distance from the
wound increases. A gradation of changes takes place after wounding.
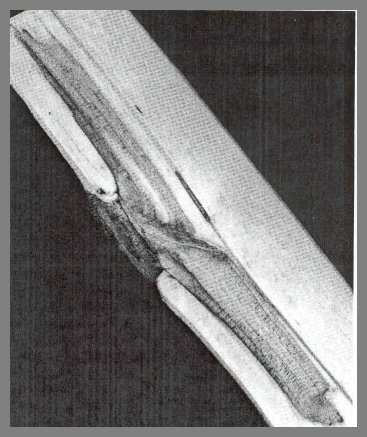
Figure 1 - Columns of discolored and decayed wood associated with a 2-year-old flush cut on a red maple. F533408
Page 14
Decay in an advanced stage, resulting from animal- caused damage in the distant past, is shown in figure 2. The column is confined to the diameter of the tree at the time of injury. The lower right section shows nearly a complete cylinder of decayed wood. The lower left section shows the decayed wood developing within the cylinder of wood that was present at the time of injury. The upper section shows the decayed and discolored wood as a smaller area, as cross cuts are made through the defect. The cylinder of wood that was present at the time of wounding is still obvious. The defects usually move as expanding cones within the cylinder of wood present at the time of injury. The wood farthest from the wound will be altered much less than the wood nearest the wound.

Figure 2-Column of discolored and decayed wood associated with a black-bear wound on western hemlock. F533410
Page 15

Figure 3-Discolored and decayed wood associated with root rot caused by Armillaria mellea in red spruce. F533411
Armillaria mellea causes decay and discoloration in many softwood species (fig. 3). This section from the base of a red spruce tree shows discolored and decayed wood, which advanced upward from the roots. Some portions of the sample show more advanced stages of discolored and decayed wood than others.
Note the extremely eccentric early growth patterns. The ER cambial zone readings may differ for many reasons, especially when a tree is growing much faster on one side than the other.
Page 16
Fomes pini causes decay that results in small, lens- shaped pockets (fig. 4). When the bowed tips of the twisted-wire electrode move into one of these small open pockets, there will be no contact with the wood; and erratic patterns of ER result.
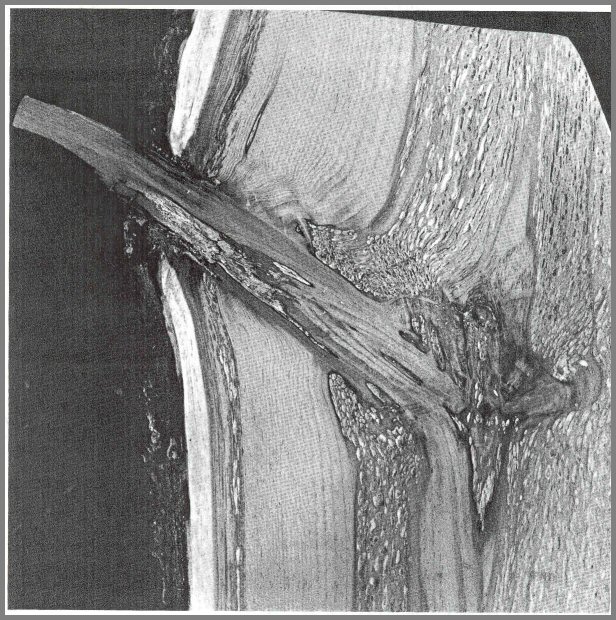
Figure 4 – Fomes Pini in eastern white pine. F533425
Page 17
The large column of discolored and decayed wood on the white fir in figure 5 is associated with many infections by Fomes pini. The needle electrodes can be used on the ends of logs to determine the condition of the wood. The ER of sound wood is compared with the ER of altered wood.
Figure 6, a section from a peach tree, shows the compartmented columns of discolored and decayed wood. Columns of discolored and decayed wood are compartmentalized within sapwood and heartwood. The tree boundaries that resist inward spread are shown by number 2's. The boundaries that resist tangential spread are shown by number 3's, and boundaries that separate the wood present at the time of injury from the new wood that continued to form are shown by number 4's. In your mind's eye, visualize how ER would change along various radii across the bands of healthy and diseased tissues.

Figure 5 – Fomes pini in white fir. F533416
Page 18
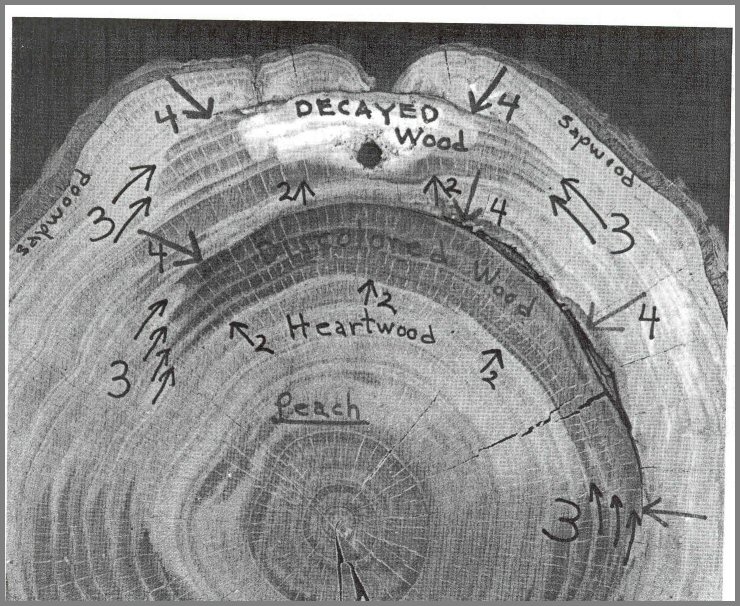
Figure 6 – Compartments of discolored and decayed wood in peach. F533412
Page 19
Root rot, basal cracks, and wetwood are common in balsam fir. The patterns (fig. 7) are orderly, especially when seen in longitudinal sections; but when cross sections are made, they appear mottled. Both wetwood and decayed wood have very low ER readings and must be distinguished by knowledge of the species being observed and other factors.
Columns of wetwood advance upward from root rots (fig. 8). Wetwood usually has a very high pH and a high concentration of ions. The needle electrodes can be used effectively on the ends of such logs to determine the degree of wood alteration.
American elm (fig. 9) normally has 18 to 30 outer rings of nondiscolored wood. Elms store starch in approximately 18 rings of sound wood. Elms also have large central columns of discolored wood that can be called wetwood. The wetwood nearest the bark is usually lower in ER than wetwood in the interior of large older trees.

Figure 7 – Wetwood and cracks in balsam fir. F533414
Page 20
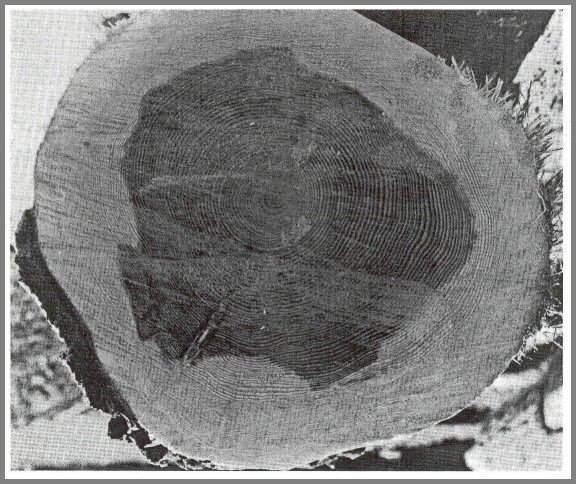
Figure 8 – Wetwood in true fir. F533415

Figure 9 – American elm. F533417
Page 21
Elms infested with Ceratocystis ulmi, the fungus causing Dutch elm disease, often have discolored wood or wet wood close to the cambium (fig. 10). When the needle electrodes are pushed into the outer bark, they penetrate the wetwood; and low readings occur in a tree with low vigor. This same situation occurs frequently in balsam fir when wet wood columns are very close to the cambium. Be alert for this problem.
The needle electrodes can be used to determine the condition of the wood on the ends of recently cut logs. The logs on the upper left and lower right of figure 11 have large columns of discolored and decayed wood. The heartwood in the other two logs is clear except for small central columns of discolored heartwood. The needle electrodes can be used to detect discolored heartwood in such logs.
Columns of discolored heartwood are common in many species of trees (fig. 12). The discolored columns are commonly associated with large dead branch stub wounds and insect galleries. Twisted-wire electrodes can be used to detect discolored columns.

Above: Figure 10 – Dutch elm disease in American elm. F533418

Figure 11 – Red oak logs. F533419
Page 22
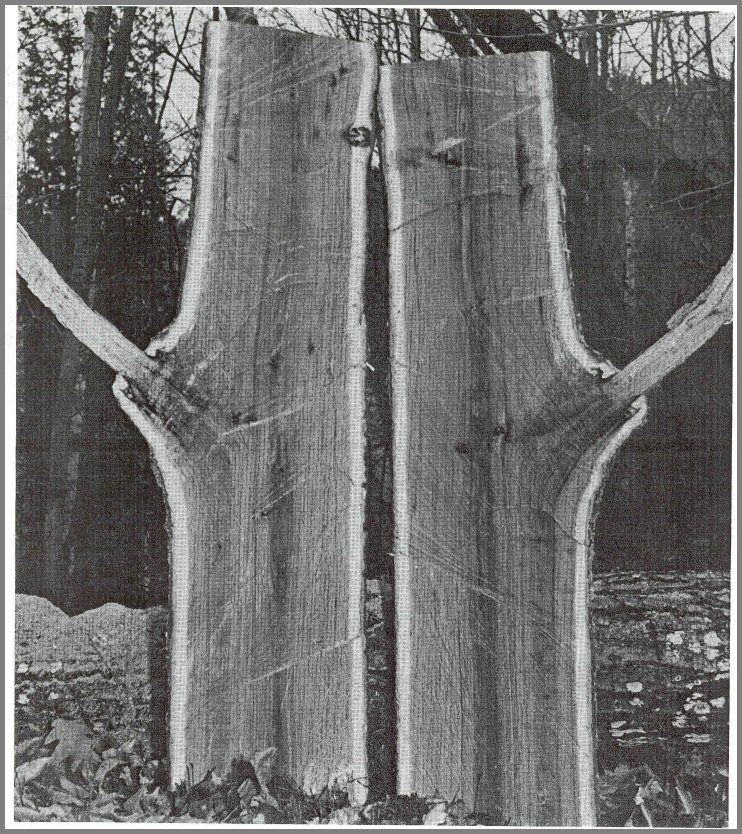
Figure 12 – Discolored heartwood in red oak. F533420
Page 23
After a tree is injured, a barrier zone forms. Figure 13 shows such a zone in a cross section of western hemlock. The barrier zone separates the infected tissues from the new tissues that continue to form after the “barrier zone” is completed. The three-dimensional view of defect columns can be determined by properly placing several drill holes for inspection.
Figure 14 illustrates a compartmentalized zone of old damage. The small arrows-show the barrier zone associated with the wound. The larger arrows show the innermost growth rings that contain resin ducts. When probes are made into such trees, usually ER abruptly increases when the inner wood is touched.
Many trees have multiple columns of defect associated with mechanical wounds or branch stubs. The center of the beech in figure 15 is sound, yet there is a ring of decayed wood between the center wood and an outer ring of discolored wood. The twisted-wire electrode penetrates many types of wood on its path into the tree.
The Shigometer can be used to detect decay in trees (fig. 16). Several inspection probes are suggested. Most columns of decayed wood at the base of the tree are associated with root rots.
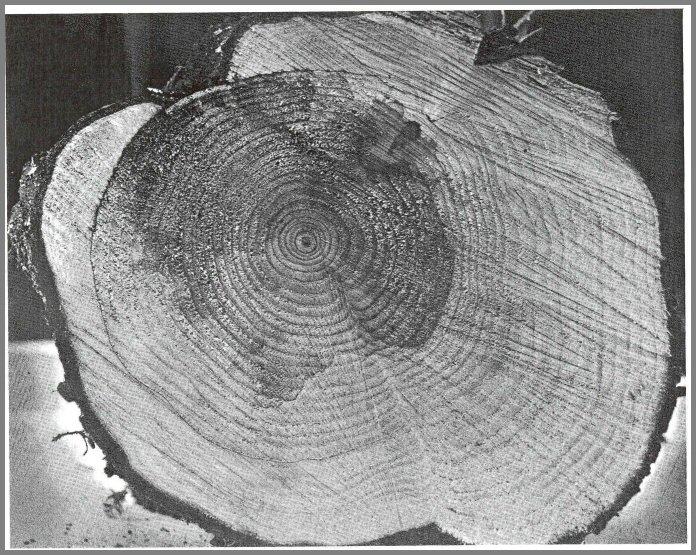
Figure 13 – Discolored and decayed wood in western hemlock. F533421
Page 24

Figure 14 – Small wound in Norway spruce. F533427

Figure 15 – Multiple columns in American beech. F533422
Page 25
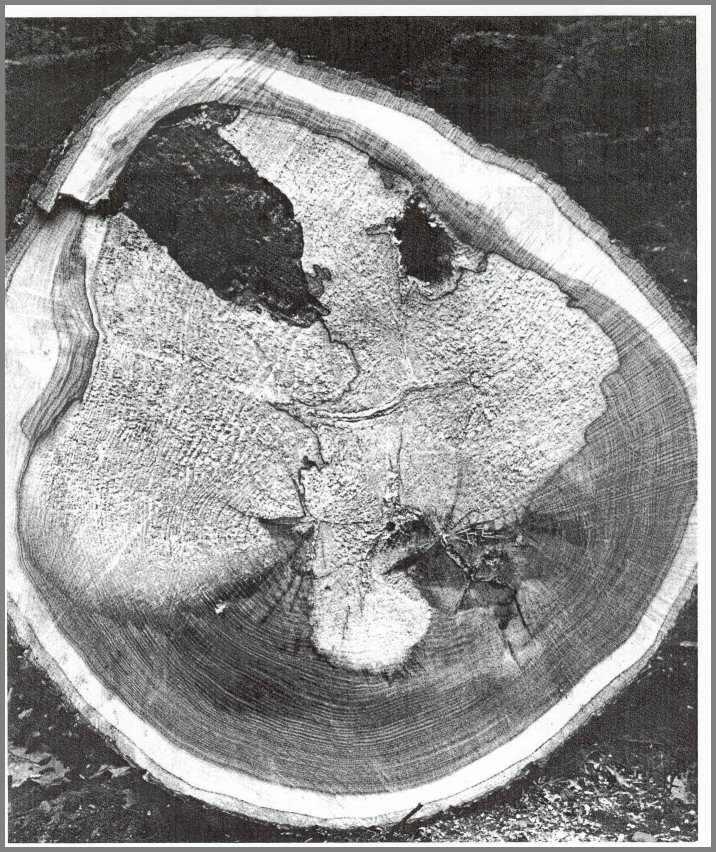
Figure 17 – Fomes pini in Douglas-fir. F533424
Page 26
Columns of discolored and decayed wood are commonly mixed with sound wood (fig. 17). When a probe is made through such tissues, a variety of ER readings result.
Dissecting the basal section of a red pine (fig. 18) shows the decayed wood and portions of sound resin-soaked wood. When the electrode is inserted into such wood, ER will increase abruptly in Resin-soaked wood before decreasing in decaying wood.
The hollows in birch trees often form after a very large stem dies (fig. 19). This large stem was probably the leader, and after it died, a branch began to grow and become the new leader. The decayed wood did not spread into the new tissues that formed after the stem died. When probes are made into such wood, ER increases abruptly as the bowed tips move into the hollow.

Figure 17 – Fomes pini in Douglas-fir. F533424
Page 27

Figure 18 – Heterobasidion annosum in red pine. F533426

Figure 19 – Hollow in birch. F533428
Page 28
The Shigometer
Figure 20 shows the Shigometer with dial ohmmeter. Accessories include battery-powered drill, twisted-wire electrode, and needle electrodes. This model is no longer manufactured.
To calibrate the meter:
a. Turn on (1).
b. Pull switch (2) upward to 50 kΩ (now ohmmeter dial reads from 0 to 50 kΩ).
c. Press zero button and hold down until next step is completed (3)
d. Turn adjust knob (4) until needle is exactly on 0 line (5).
e. Press calibration button and hold down until next step is completed (6).
f. Turn 50 K knob (7} until needle is exactly on 50 line (8).
g. Push switch (2) downward to 500 kΩ (now dial reads from 0 to 500 kΩ).
h. Press calibration button and hold down until next step is completed (6).
i. Turn 500 K knob (9) until needle is exactly on 50 line (8).
j. Insert plug (10) for either twisted-wire electrode or needle electrodes (the plug can be inserted in either direction).

Figure 20 – Shigometer with dial ohmmeter. F533429
Page 29
Accessories for the Shigometer with digital display (fig. 21) include drill and electrodes. This model is made by Osmose Wood Preserving Co., Inc., of Buffalo, NY. To calibrate meter:
a. Attach twisted-wire electrode or needle electrode to connecting cord.
b. Attach connecting cord jack into input outlet (I).
c. Set switch (2) to zero. Adjust zero control (3) until display reads "0 plus on minus 1."
d. Set switch (2) to calibrate. Adjust calibration control (4) until display reads "200 plus on minus 1."
e. Set switch (2) to measure. Insert electrode in sample and observe display.
f. To check batteries, set switch (2) to battery test position and observe display. Be suspicious of batteries when display reads below 12.
This Shigometer should stay calibrated for several hours or days of use unless the controls are moved. It is good to check the calibration twice a day, or whenever the operator suspects that the controls have been moved.
There are many types of drill bits that can be used to make holes for the wire electrodes (fig. 22). Most drill bits (four on left) are three thirty-seconds of an inch (2.4 mm) in diameter. Some (two on right) are seven sixty-fourths of an inch (2.8 mm) in diameter. Drill bits have different amounts of flute length. Avoid drills that have very short flute lengths. Make certain

Figure 21 – Shigometer with digital display.
Page 30

Figure 22 – Drill bits. F533431
that the drill bits are very sharp. A dull bit not only will make the drilling difficult but also will result in a hole that has many ragged edges and causes erratic ER readings. Drill bits should be at least 8 inches (20 cm) long.
To drill correctly, cup the hand lightly and carefully around the drill bit to guide it into the tree or utility pole (fig. 23). The hand will feel any bend in the bit, which is a sign to regulate the pressure you exert on the bit. Drills do break. Be careful. Learn to recognize the sounds of the motor. Push the drill near its top speed, but not so hard that the bit bends.
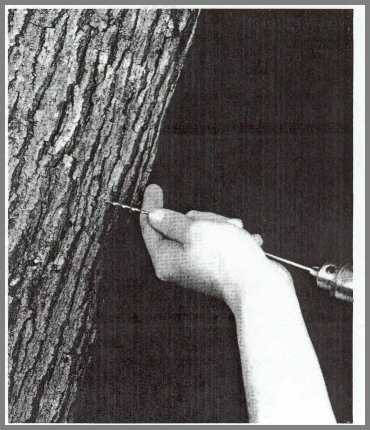
Figure 23 – Drilling method. F533432
Start drilling the hole by making several rapid in-and- out drills so as to keep the flutes clear of shavings. A void quick jerks that might break the bit. Drill in and out to 2 or 3 inches (5 or 8 cm) into the wood before going all the way into the tree or pole. Do not stop the drill while the hole is being drilled. Pull the bit out rapidly while it is turning. Move the drill into the hole a few additional times after it has been made to clean out shavings. Do not touch the bit, especially after removing it from the hole. The metal can get very hot. When the bit is taken out of a tree, the hole usually constricts. But in a pole or wood product, the hole usually stays the same diameter. Because the tree holes may constrict, it may be necessary to use an electrode with a smaller diameter. There are electrode probes for both tree and pole, but the drill bit seven sixty-fourths of an inch (2.8 mm) in diameter is being used for trees and poles now.
Page 31
The tips of twisted-wire electrode should fit snugly into the drill hole. The bowed tips should be one above the other as they enter the drill hole (fig. 24). The ER will change slightly even in uniformly appear- ingsound wood.
Before inserting the electrode, make certain that no dirt or sap is between the tips. The ohmmeter should read 500 kΩ or beyond when a clean electrode tip is in open air. Move your fingernail through tips to clean them, and to restore some spring. Be alert for broken or scratched surfaces on the electrode. If erratic readings occur, check the insulation carefully. Discard damaged electrodes. When the electrode tip touches the end of the drill hole, the tips make additional contact with the wood and a lower ER results. Discount the last reading in trees and poles.
While inserting the twisted-wire electrode, your fingers should not leave the tree bark or the surface of the tree or pole. If the electrode is too loose, use a larger one; if it is too tight, use a smaller one. You should feel some resistance to pushing it in. It is best to insert the electrode at intervals of one- or two- fifths of an inch (0.5 to I cm) in an even rhythm. With practice, you will notice small voids and decayed wood. The twisted-wire electrode will bend if it is inserted improperly. Never hold it by the plastic cap. Bent electrodes can be straightened with care.
If you need to sample utility poles with the Shigometer, drill holes slightly downward at the base of the pole. When drilling downward below the groundline into a pole, start by setting the drill hole in a horizontal position and then continue the drilling downward. It is very difficult to start drilling in a downward position. The electrode should be inserted into the pole in such a way that your fingers are touching the pole at all times. If this is done properly, the electrode will not bend. Dial meters should be on the 500 kΩ scale. When you complete the procedure, always fill the hole with a wood preservative.
In figure 25, the ER readings from the twisted-wire ,electrode are shown on the cut stump of a root-rotted pine. To show the pattern, the drill holes were made

Figure 24 – Position of electrode tip. F533435
Page 32
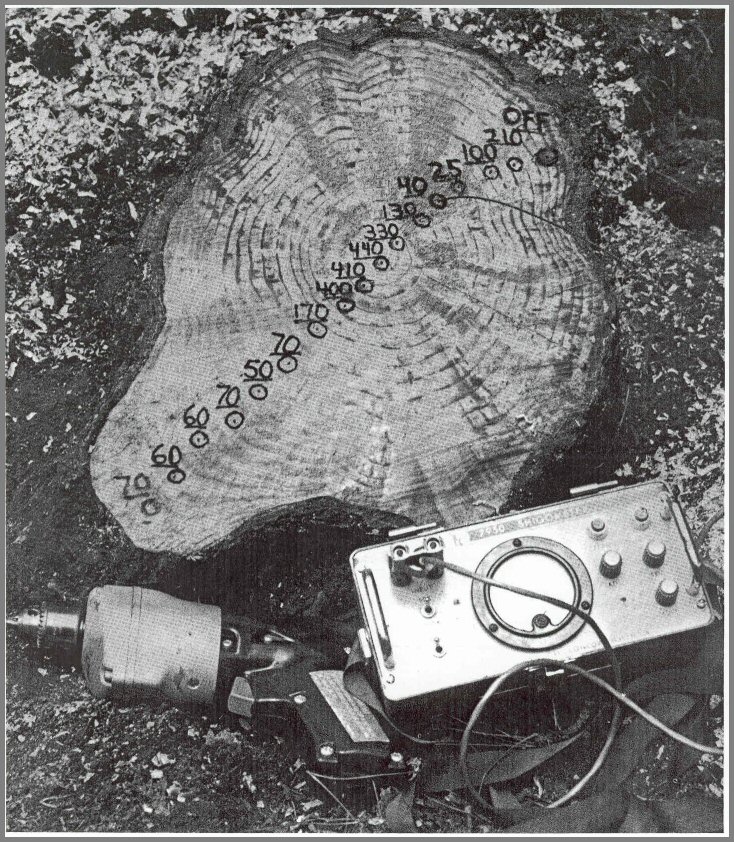
Figure 25 – Patterns of ER in root-rotted pine. F533438
Page 31
four-fifths of an inch (2 cm) into the circled areas. The tip was placed two-fifths of an inch (1cm) into each hole. Note the patterns on the lower portion of the stump and compare them with the ER readings in the stump area that has decayed wood associated with annosus root rot (caused by Heterobasidion annosum). The ER pattern in the decayed area is very erratic due to resin-soaked wood and decayed wood. Such patterns are typical for root rot associated with H. annosum
Figure 26 demonstrates the proper position for the"' double-needle electrodes-one needle above the other. The needles should be inserted into the vertica1 fissures in the tree bark. The needles should be
pushed into the bark until they touch the wood. When the needles penetrate a very thin cambial zone, the ER will be high. When the needles penetrate a thicker cambial zone, the ER will be low.

Figure 26 – Double electrodes in trees. F533439
Figure 27 shows the needle electrode with protective cover. Plastic discs should be placed over short needles (fig. 28) to avoid moisture contact with the flat surface of the needle retainer.

Figure 27 – Needle covers. F533440

Figure 28 – Short double-needle electrodes. F533441
Page 34
Many different types of electrodes and methods for placement of electrodes can be used with the meters (fig. 29). Most important is that the electrodes and their methods of use are standard. Very small electrodes can be used for small trees or for animal tissues. Here single needles are used as electrodes.
The ends of wood flitches that are used for making tops of violins can be measured for their ER profiles (fig. 30). The section of wood must be soaked in water for several hours and then the surface must be blotted. The smaller needles are used to penetrate the wood. The measurement should be made at intervals two-fifths of an inch (1 cm) from the cambial side inward.
The graph in figure 31 compares five ER patterns from five spruce flitches that were drying for many years. Note the great variation in ER patterns, especially between sections 94 and 227. Three basic patterns exist: (very high ER readings, (2) intermediate patterns, and (3) all low ER readings. Violins made from wood samples 94 and 227 produced distinctly different sound. More research is needed to determine which ER pattern is associated with wood that produces the best resonating instrument.

Figure 29 – Above - Other types of electrodes. F533442

Figure 30 – Above - ER and violins. F533444

Figure 31 – ER patterns on spruce for violins. F533445
Page 35
Shigometry can be used to detect active decay in many types of wood products (fig. 32). When the decayed wood is dry, it can be rewet and then measurements taken. Two or three drilling holes must be made-one hole for the electrode above one or two holes for water. Water is forced into the lower holes. After a minute the twisted-wire electrode is inserted into the upper hole. As the water moves into the lower hole, any wood that is decayed will absorb the water quickly and the ionic state will be reconstituted. When the electrode tip moves into such a moist decayed area, a sudden decrease in resistance results.
The Shigometer is not a moisture meter, however. The meter functions only above the fiber saturation point, which is 27 percent. When an electrode is placed into pure distilled water, the ER will be far above 250 kΩ, and if the water is very pure, the ER will be above 500 kΩ. When the same electrode is

Figure 32 – The Shigometer detects decay in many types of wood products. F533448
placed into tap water, or water that has a very small amount of salt added, the ER will be very low. The same kind of situation occurs in trees and wood products. After a moisture continuum is formed, additional water will have very little effect on resistance.
Utility Poles
Many problems that occur in utility poles have their origin in the living tree. Most columns of defect in poles end abruptly. Wood that appears sound may in fact be highly ionized and ready to break down-the beginning of a short-lived product.
Figure 33 shows a sound utility pole. It is absolutely essential to know the ER patterns of sound tissues before work is done to detect decay. As the electrode moves into a drill hole, there will always be slight changes in ER. Make a complete measurement throughout the hole first to determine whether any great decreases occur. In sound wood, there will be many small changes, but they still result essentially in a straight line reading. This occurs whether the changes are at a low or high pattern. ER readings below 50 kΩ are suspect.

Figure 33 – Sound utility pole. F533449
Page 36
The cross section in figure 34 shows a utility pole with brownrot. Brownrot usually ends abruptly, but the wood far beyond the visual rot will be altered.
The upper electrode is deep inside this pole, and the bowed tips are in sound-appearing wood directly in front of the decayed wood. The ER for this wood is 210 kΩ as shown on the meter to the left. The lower electrode is only a short distance into the pole. The tips of the electrode are in sound, well-preserved wood. The ER for this wood is beyond 500 kΩ. The cross section in figure 34 shows a utility pole with brownrot. Brownrot usually ends abruptly, but the wood far beyond the visual rot will be altered.
The upper electrode is deep inside this pole, and the bowed tips are in sound-appearing wood directly in front of the decayed wood. The ER for this wood is 210 kΩ as shown on the meter to the left. The lower electrode is only a short distance into the pole. The tips of the electrode are in sound, well-preserved wood. The ER for this wood is beyond 500 kΩ, as shown on the meter to the right. Wood that appears sound but is moist and is highly ionized will have a low ER reading and will soon decay. When such sound-appearing wood is examined from the increment cores, it appears that the wood is really sound when it is actually in an early stage of decay. Industry has not learned to accept that wood does not go directly from sound to decayed. Even though the method can detect the early stages of decay, industry does not call it "decay" until the wood is visually broken down. Yet, treatment of poles in early stages of decay offers the best way to greatly increase the life of the pole.
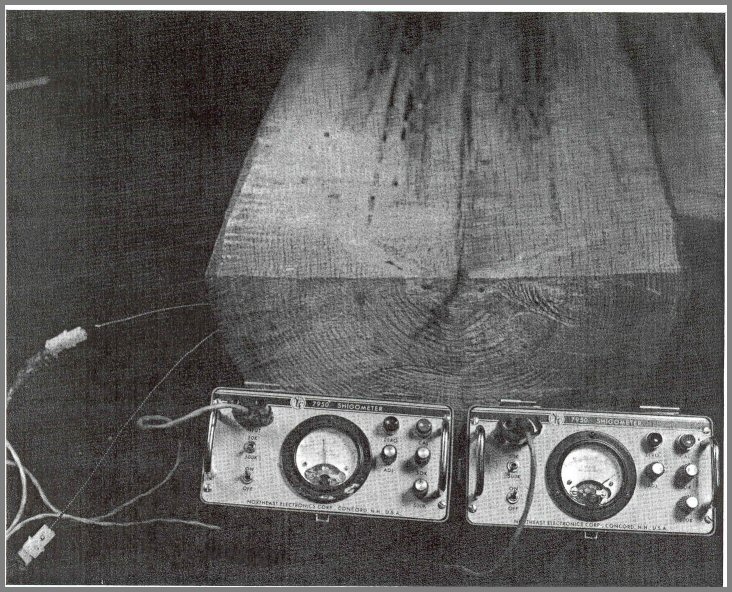
Figure 34 – Brownrot in a utility pole. F533450
Page 37
The drill hole in poles is very small compared to the hole made by increment borers and by large drills (fig. 35). The small drill hole should still be filled with a preservative.
Increment cores (fig. 36) cannot be used as dependent variables for ER profiles. The condition of the wood

Figure 35 – The drill hole on the left is much smaller than the holes typical of increment borers or large drills. F533458
in the increment core is determined by visual inspection. The increment core shown here was taken at the exact point shown on this dissected pole. The core

Figure 36 – Increment core taken from a partially decayed pole. F533451
Page 38
was only a few centimeters outside of the obvious column of decayed wood. The core appears perfectly sound. The profile of ER readings taken at the same point showed that wood was altered at the point shown by the arrow. When increment cores are used together with the Shigometer, there will always be confusion because the ER readings will seldom correlate with the cores. Many studies with ER profiles have been done on dissections that showed where the column appeared to end, but the wood beyond was in an early stage of decay.
Early changes in wood condition can be detected with the needle electrodes. When the needles are pushed into such altered wood, a very low ER reading will result. When wood in utility poles is below 50 kΩ, it is suspect. Pockets of rot in utility poles are usually 8 inches (20 cm) above ground level and 18 inches (45 cm) below groundline. When decay is active, moisture is above the fiber saturation point. When the needles go deep into the utility pole, the decayed condition is obvious.
The needle electrodes can also be used to detect soft rot at groundline in utility poles (fig. 37). The defect in this pole was closely associated with the hole that

Figure 37 – Detecting soft rot in utility poles. F533454
was made for internal examination of the pole. When ER readings are below 50 kΩ at groundline, softrot is probably present. In practice, when the pole is upright, the needles should be beside each other when inserted.
Decayed wood often is found in pockets above and below large branch stubs. A probe into such tissues will show decayed wood between outer sound wood and inner sound wood. The best position for an internal check is close to cracks. As the electrode tip moves into the decayed zone, ER decreases. When the in-between defect is a hollow, a sudden increase in resistance occurs. In many of these zones, the decayed wood may be so advanced that the tip passes from contact areas to open air. Along with the erratic ER readings will be a release in movement pressure on the electrode. The operator will know that advanced decayed wood has been penetrated. It is difficult to reenter the drill hole on the opposite side of a hollow.
In figure 38, the decayed wood at right is associated with a large stub. Another column of decayed wood is
Figure 38 – Multiple patterns of decayed wood in poles. F533456
Page 39
spreading downward on the left. Poles with large branch stubs usually have a short life.
The dissected sample in figure 39 shows a central column of brownrot. The rot is confined to the wood that was altered early in the life of the tree. Most columns of defect in poles follow the compartmentalization pattern that was set when the tree was living

Figure 39 – Central decay in poles. F533457
An experimental model of the Shigometer that has a built-in microprocessor (fig. 40) is now being tested. The meter will store a great amount of information that at a later date can be put into a larger computer. The small computer also will give the desired measurement on the face.

Figure 40 – Computerized Shigometer. F533459
Page 40
ER Patterns
As the electrode tip moves into a sound tree, the ER readings increase (fig. 41).
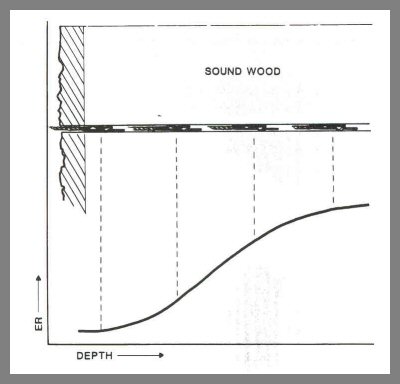
Figure 41 – ER patterns in sound wood.
Figure 42 illustrates the ER profile in altered wood. When the tips touch wood that has a higher concentration of moisture and ions, ER suddenly decreases. To determine the depth of the altered wood, as soon as ER decreases, hold the electrode by two fingers and pull it out of the pole. The length of the probe from your fingers to the bowed portion of the tips will be the depth of sound wood.

Figure 42 – ER patterns in altered wood.
Page 41
Figure 43 shows the typical pattern of ER in heartwood-forming trees. A second abrupt increase in ER occurs as the tip moves from the sapwood into the heartwood.

Figure 43 - ER patterns in heartwood-forming trees.
An abrupt decrease signals concentrations of moisture and ions, which may indicate discolored wood or decayed wood (fig. 44).

Figure 44 – Patterns of ER in decayed wood.
Page 42
The electrode tips may move from sound to decayed wood and back to sound wood. The ER will decrease in altered wood and increase in sound wood (fig. 45).
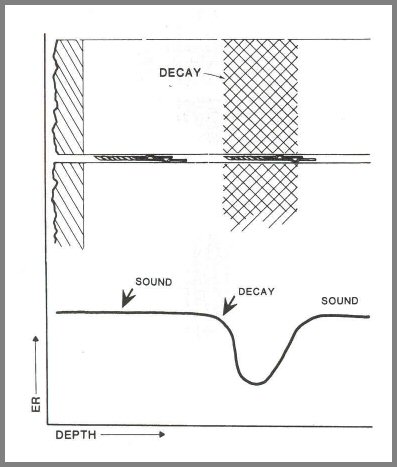
Figure 45 – Multiple patterns.
When the electrode tip moves into dry, decayed wood (fig. 46), the ER increases. Dry, decayed wood is near old open wounds. When using the method in such areas, make the measurements at least 1 or 2 ft (0.3 or 0.6 m) above or below such wounds.

Figure 46 – Dry, decayed wood.
Page 43
When the electrode tip is pushed into resin-soaked wood, ER increases (fig. 47). Learn to recognize patterns indicating resin-soaked wood.

Figure 47 – The pattern in resin-soaked wood.
In conifers, several types of root rots are characterized by bands of decayed wood and resin-soaked wood. When the electrode tip moves through the bands, ER increases and decreases. This pattern (fig. 48) of abrupt increases and decreases in ER is typical for root rots.
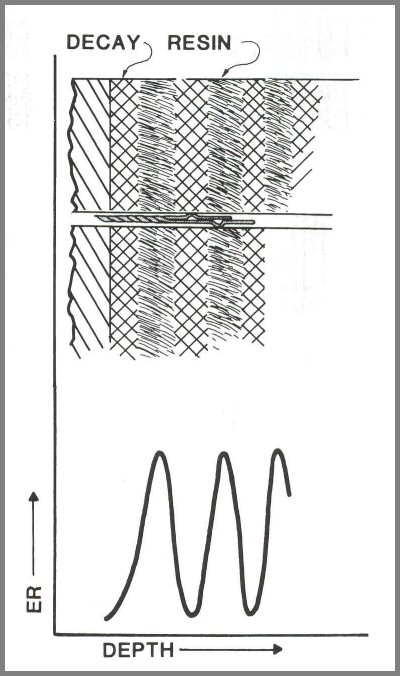
Figure 48 - The ER pattern of wood from trees with root rot.
Page 44
When wetwood is penetrated, the wet wood fluids flow out of the hole. The hole cannot be used for a measurement because the walls will be saturated with moisture. To determine the position of the wetwood, drill a hole two-fifths of an inch (1 cm) above the first hole and continue to drill in increments of two-fifths of an inch (1 cm) until the wet wood is reached (fig. 49).

Figure 49 – Proper drilling technique for a tree with wetwood requires several penetrations.
Page 45
Selected References
Report problems to John A. Keslick, Jr.